
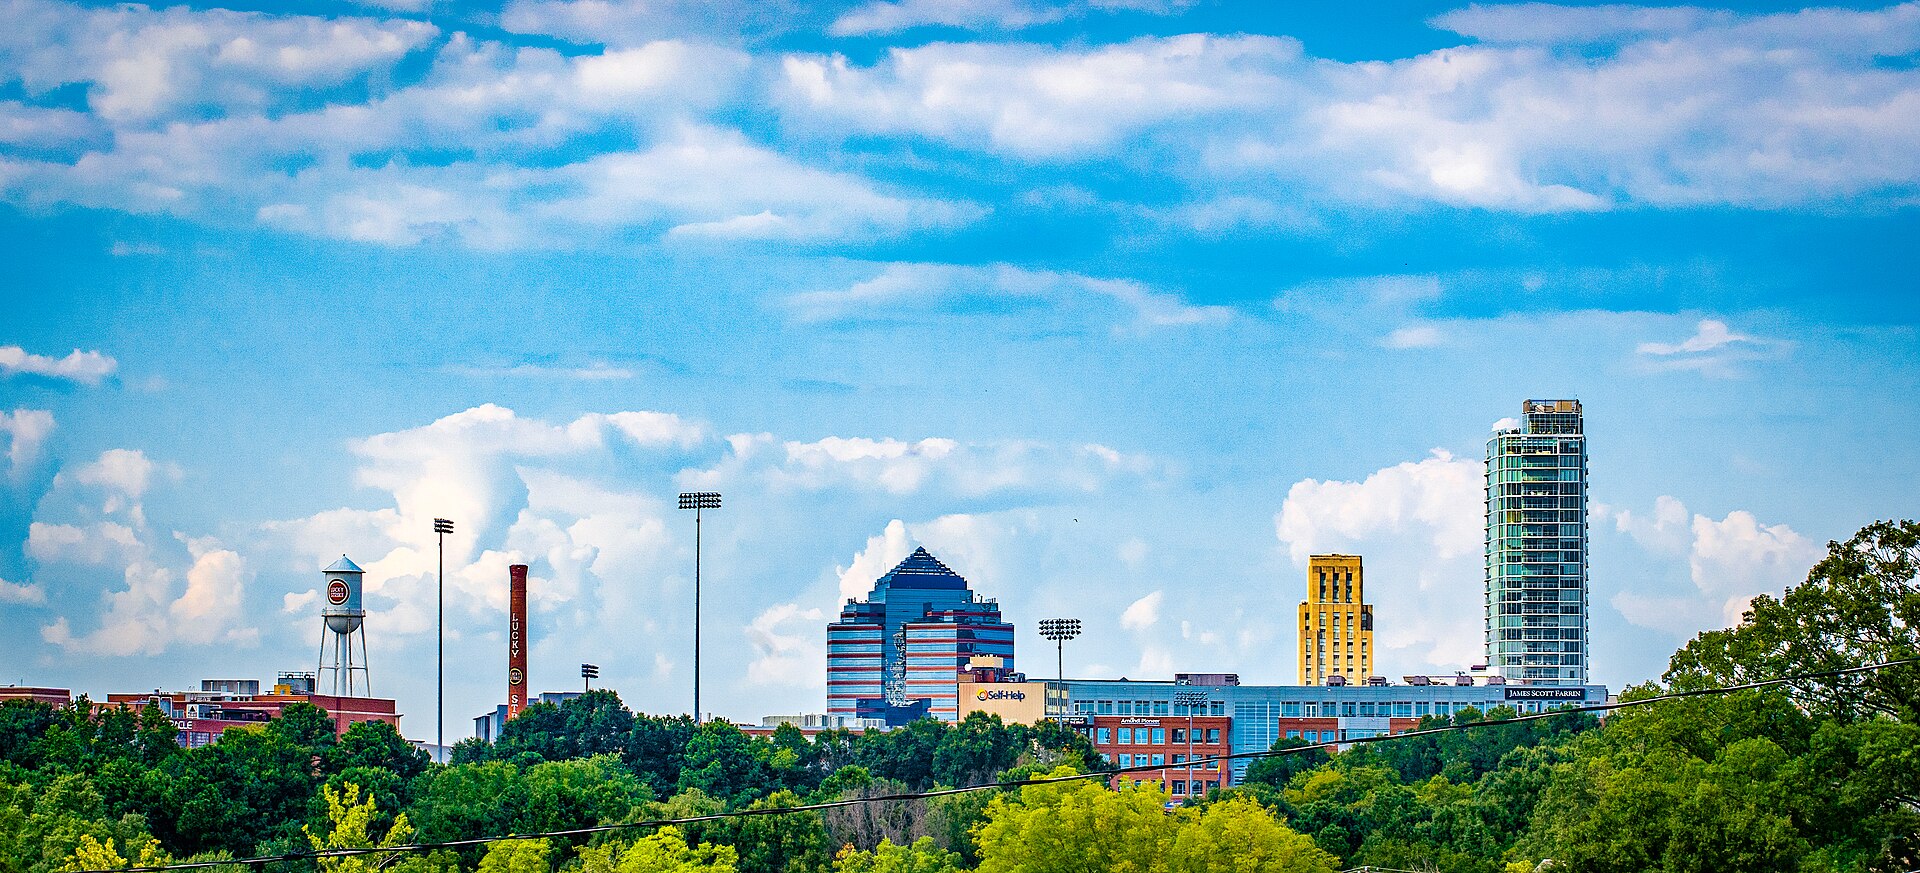
Durham County Market Update
Durham, Research Triangle Park & the Ninth Street corridor — the October numbers from Triangle MLS, and what they mean if you are buying or selling this fall. Refreshed monthly.
The read
Flat price. Faster sales.
Durham’s median settled this month. The October median sale price is $405,000, down 0.2% from $406,000 last October, after a year of double-digit year-over-year swings. Days on market tell the better story: 49 days now versus 55 last October, so the homes that are selling are selling faster. Closings fell 15% to 295.
Active listings are up 14% to 1,541 with 4.3 months of supply, so buyers have more to look at than they did a year ago even as the price holds. Downtown and the Ninth Street corridor hold their value; the softness is concentrated in 2021–2022 purchases in the northern and eastern suburbs coming back to market.
Five counties, one region
Where Durham sits against its neighbors.
Wake has the most homes and the tightest supply at 3.9 months, Durham’s median is flat year over year with faster sales, Orange posted the biggest price drop on the smallest sample, Chatham now carries the region’s highest supply at 5.3 months, and Johnston is the only county still appreciating.
| County | Median sale price | Days on market | Homes sold | Active listings | Supply | P&I on the median* |
|---|---|---|---|---|---|---|
| Wake →Wake County | $467,500-2.4% YoY | 53 days+3 vs last year | 1,275-9.0% YoY | 5,476+7.5% YoY | 3.9 mo | $2,534/mo |
| DurhamDurham County | $405,000-0.2% YoY | 49 days-6 vs last year | 295-14.7% YoY | 1,541+14.1% YoY | 4.2 mo | $2,195/mo |
| Orange →Orange County | $471,160-13.5% YoY | 56 days+8 vs last year | 113-16.3% YoY | 590+41.8% YoY | 4.8 mo | $2,553/mo |
| Johnston →Johnston County | $358,000+2.3% YoY | 68 days-5 vs last year | 317-16.1% YoY | 1,606+15.1% YoY | 4.7 mo | $1,940/mo |
| Chatham →Chatham County | $607,450-6.7% YoY | 50 days+0 vs last year | 91-7.1% YoY | 508+22.4% YoY | 5.3 mo | $3,292/mo |
*Principal and interest at this week’s 7.18% 30-year rate with 20% down. Supply is months of inventory at the current sales pace. See the full mortgage update →
What it means
Buying or selling in Durham County.
More choice, and more room to negotiate.
- Inventory is up about 14% to 1,541 homes and months of supply sit at 4.3. Negotiate on price, repairs, closing costs and timing — often more than one.
- The 30-year fixed eased to 7.18% this week from 7.24% last week and now sits 22 basis points below its mid-October high of 7.40%, so run the payment before you settle on a price range. Builder rate buydowns in the Triangle are worth a real look if your search includes new construction.
- Get a sewer scope on anything built before 1985 and ask about well and septic outside municipal limits — common in Chatham, Johnston and northern Wake.
Price to this market, not last year’s.
- The median home takes 49 days to go under contract, six fewer than a year ago. Past 30 days it is usually the price talking, not the market.
- Treat the first two weeks as your best shot at full price. Expect more negotiation on repairs and terms than a year ago.
- Pre-list inspection and a clean disclosure package shorten the negotiation window and keep the deal together.
The payment
What the median Durham County home costs each month.
$405,000 with 20% down is a $324,000 loan. Here is the principal and interest at this week’s rate, last week’s, and a year ago.
Rates are Freddie Mac’s 30-year fixed average. Full mortgage update → · Current Triangle builder incentives →
Region-wide
Our latest Triangle updates.
Cape Fear Market Update — November 9, 2026
Redfin's county data is still on September, but the 30-year fixed has fallen a third straight week to 7.18% — about $60 a month off mid-October.
Read the update →Cape Fear Market Update — October 26, 2026
New Hanover's year-over-year decline narrowed to 1.3% on September data and the 30-year fixed eased to 7.32%, its first drop since August.
Read the update →Cape Fear Market Update — October 12, 2026
The 30-year fixed climbed to 7.40%, adding about $100 a month to a $400,000 loan since our last update, while county medians held roughly flat.
Read the update →Sources: Triangle MLS (Doorify) market statistics for Durham County, residential property class, pulled November 10, 2026 — median sold price, average days on market, closed sales and active listings are October 2026 against October 2025; months of supply is the MLS absorption rate for October 2026. Freddie Mac Primary Mortgage Market Survey, week ending November 5, 2026. County-level figures, not a valuation of any specific property. Payment figures are principal and interest only on a 30-year fixed loan with 20% down; they exclude taxes, insurance and HOA and are illustrative, not a loan offer.
Want a read on your street?
County medians are a starting point. We will tell you what your neighborhood is doing this month.
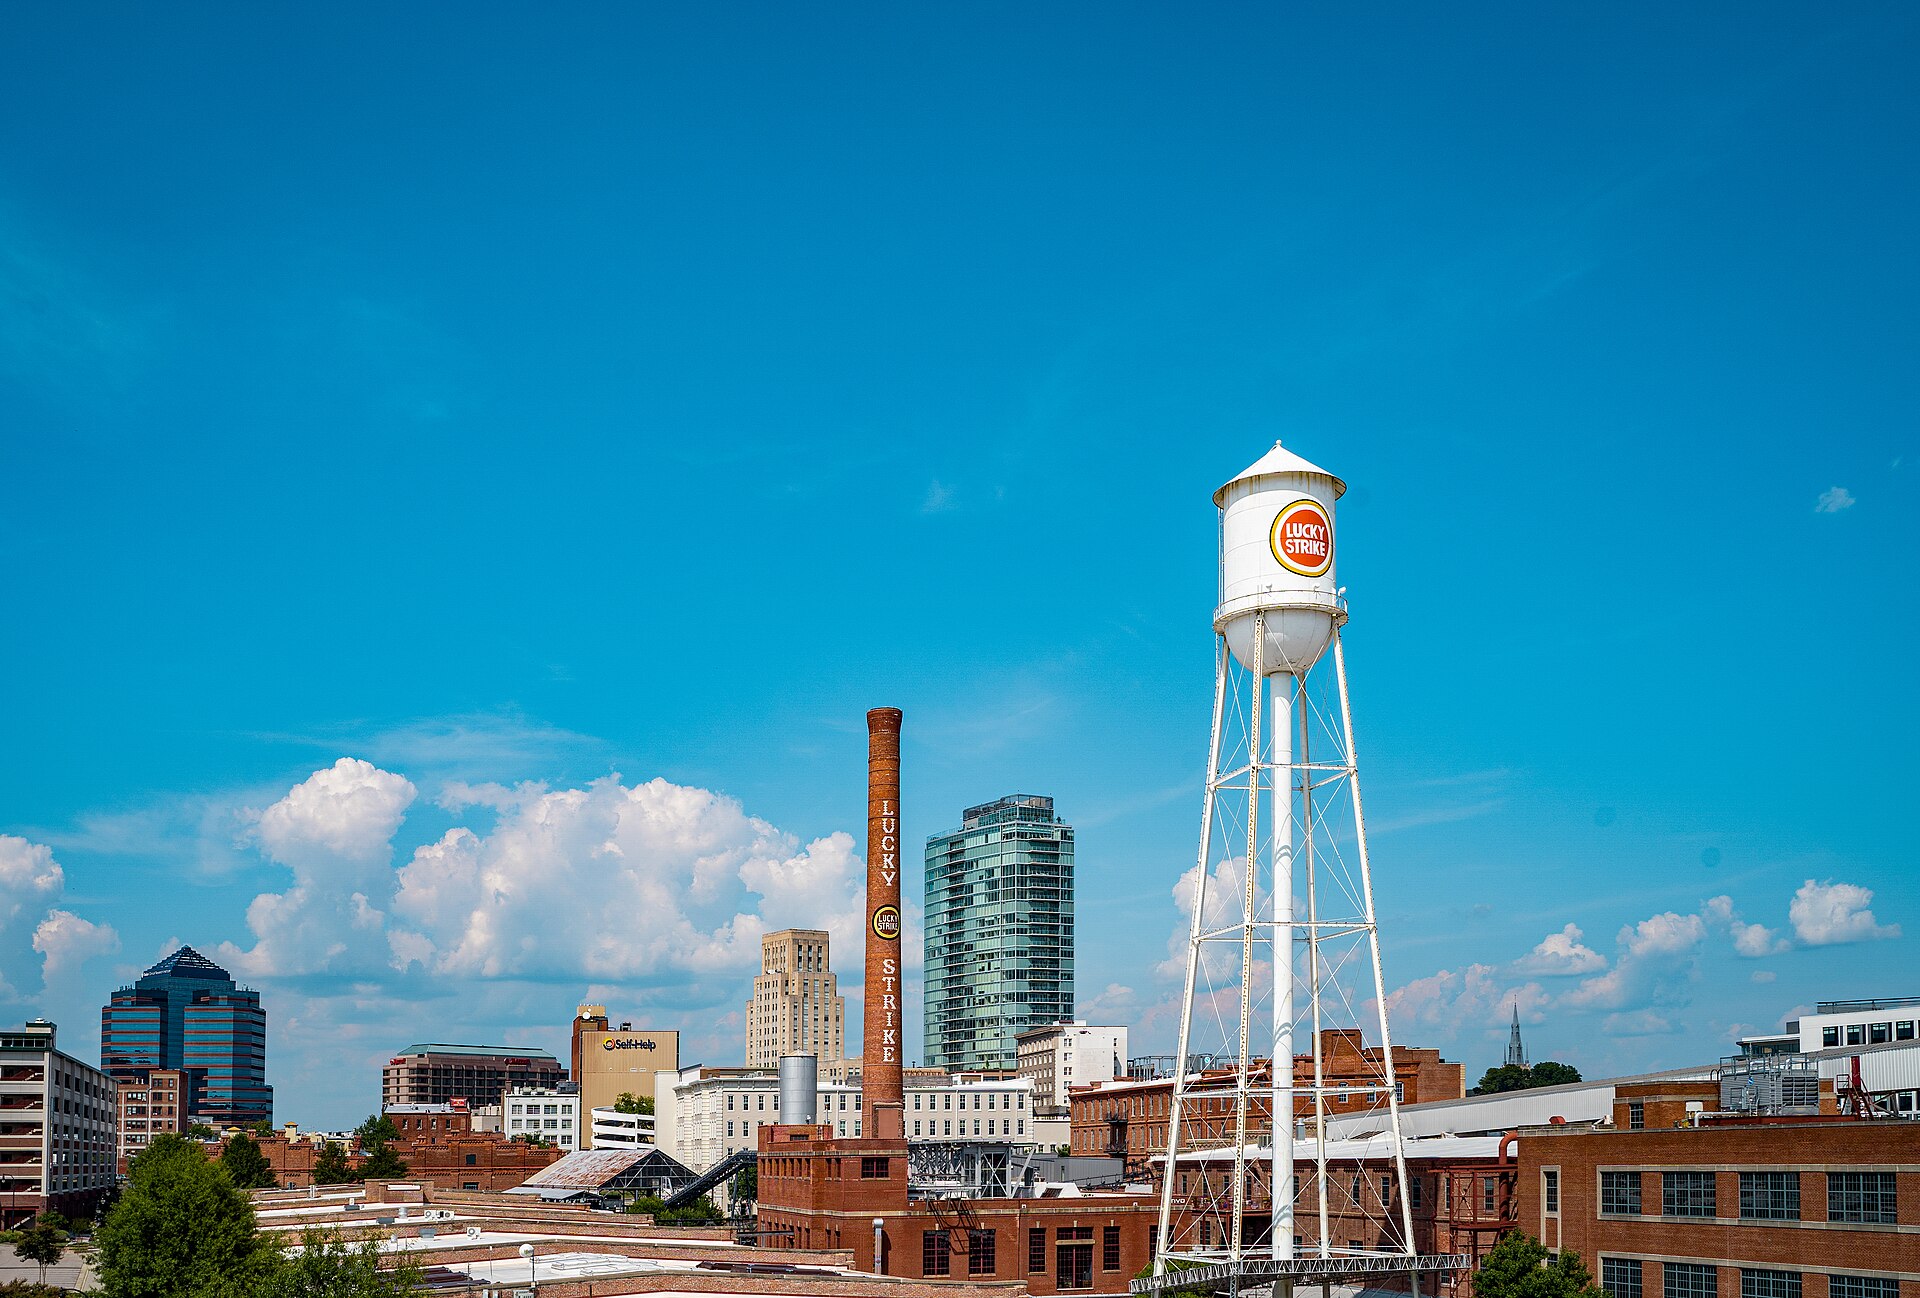
Photo: Discover Durham (CC BY 4.0) via Wikimedia Commons